

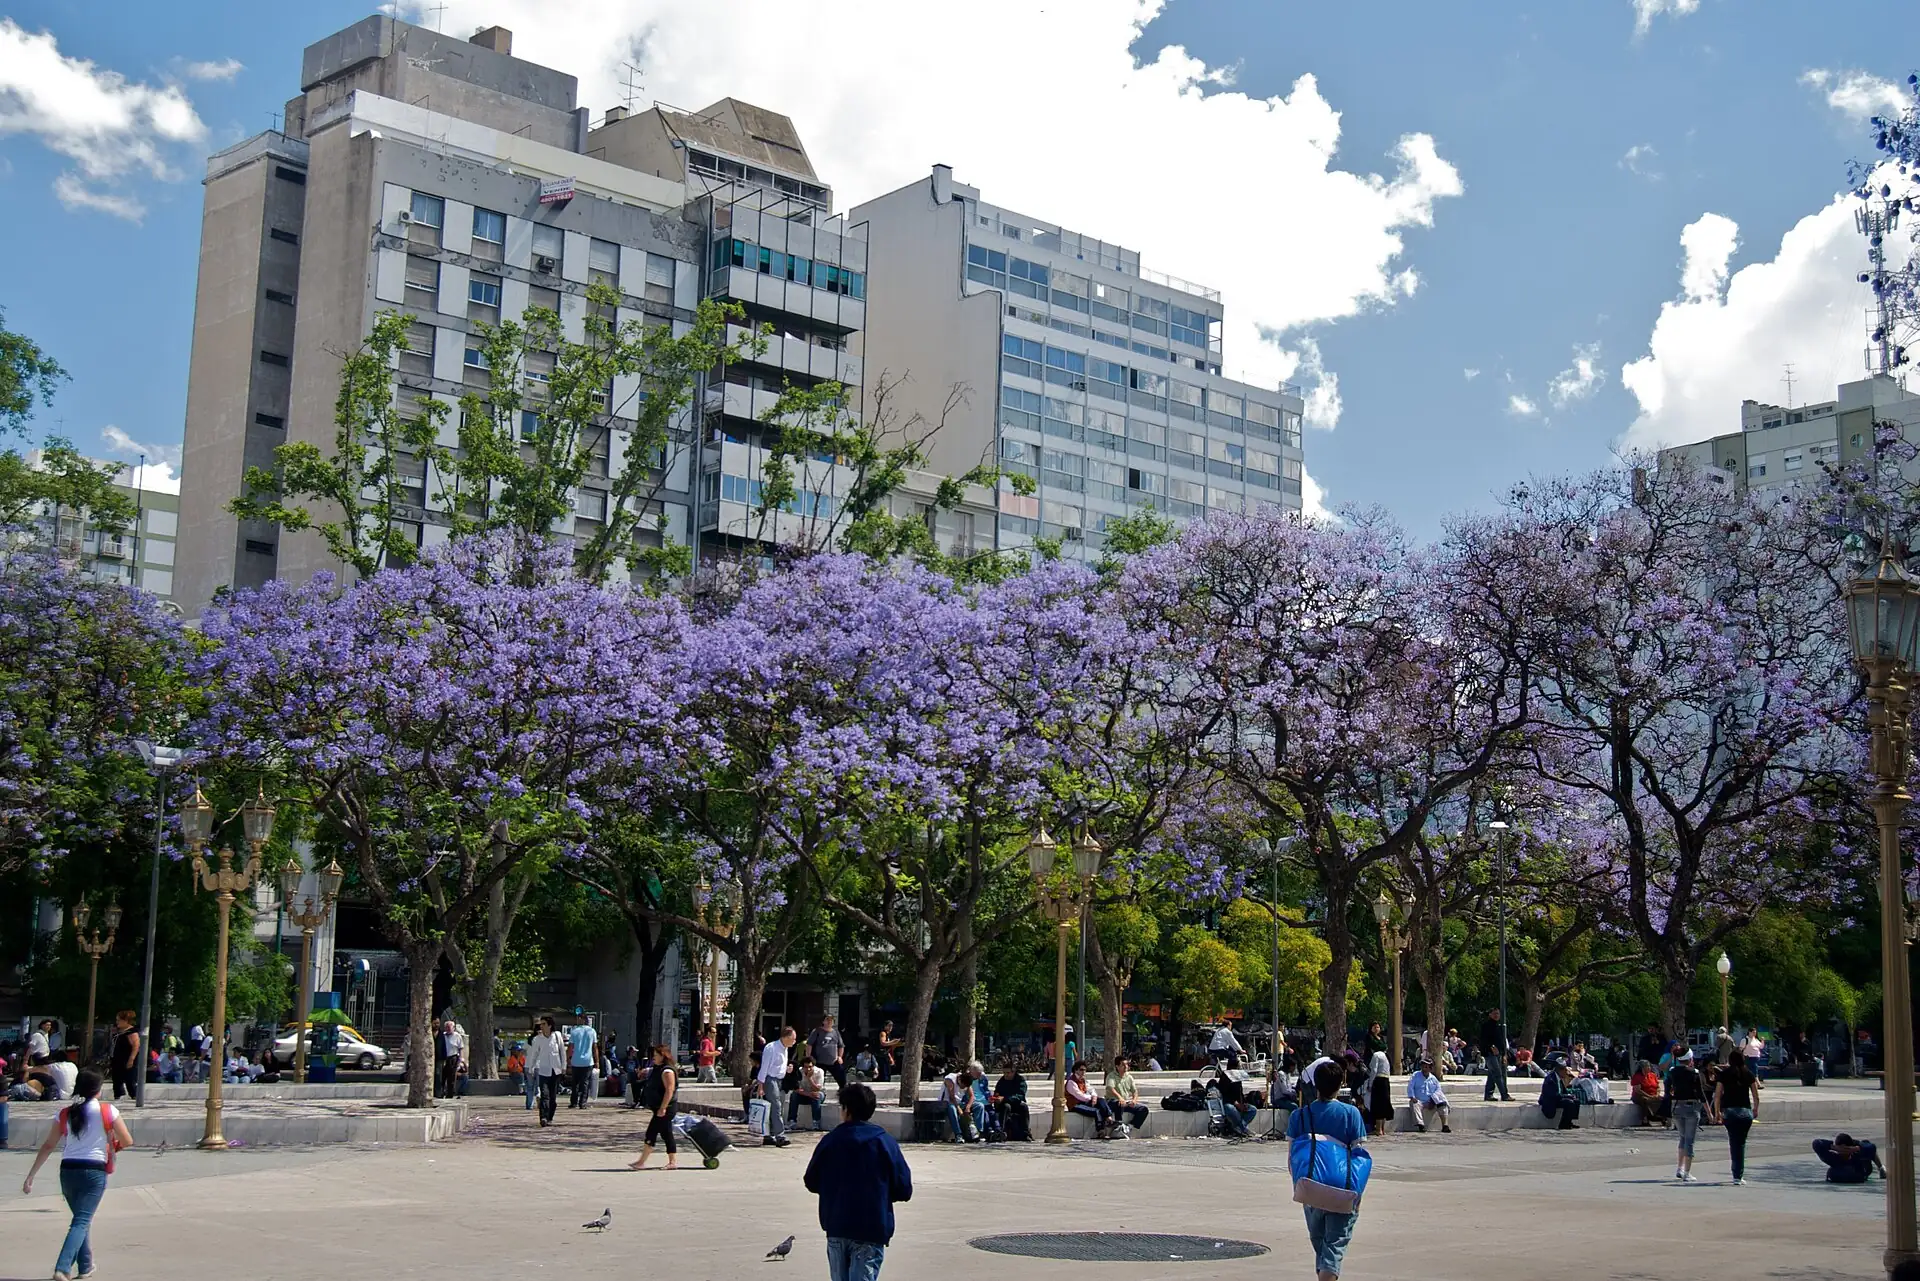
Buenos Aires relocation guide
Buenos Aires weather by month
Buenos Aires has four distinct seasons, with a hot summer, cool winter and rain in every month rather than a tropical dry season.
- Annual mean temperature
- 18.1°C (64.6°F)
- SMN Observatorio, 1991 to 2020
- January average high
- 30.1°C (86.2°F)
- Warmest monthly average high
- July average low
- 7.5°C (45.5°F)
- Coldest monthly average low
- Annual rainfall
- 1,257.7 mm (49.5 in)
- Published annual normal, 1991 to 2020
On this page
The short answer
Buenos Aires averages 18.1°C (64.6°F) across the year at SMN's Observatorio station. January highs average 30.1°C (86.2°F), while July lows average 7.5°C (45.5°F). Annual rainfall is 1,257.7 mm (49.5 in). October averages the most days with at least 1 mm of rain, at 7.9. For a first move, March or October usually gives a more comfortable apartment-search routine than midsummer.
- January reaches a 30.1°C (86.2°F) average high. Test apartment cooling before a summer move.
- July lows average 7.5°C (45.5°F). Inspect heating and window seals for winter comfort.
- 1,257.7 mm (49.5 in) of rain a year. Every month has rain in the official normals.
- October averages 7.9 rain days. Rain days mean at least 1 mm, rather than any drizzle.
- Use live SMN alerts. Thirty-year normals are planning references, and do not forecast your moving week.
Buenos Aires climate at a glance
Tool
Buenos Aires by month
SMN Buenos Aires Observatorio, WMO 87585, 1991 to 2020 normals.
Average highs range from 60°F to 86°F. Rainfall peaks at 134.4 mm a month. Servicio Meteorológico Nacional, WMO 1991 to 2020 climate normals archived by NOAA (opens in a new tab)
The climate tool uses the complete SMN 1991 to 2020 normals for Buenos Aires Observatorio, WMO station 87585. The station sits at 25 m above sea level. Its monthly highs, lows, means, rainfall and rain-day counts come from the same source. The values describe a long-term baseline, rather than today's conditions.1
Use Buenos Aires neighborhoods to plan the apartment location. Then use the climate table to inspect cooling, heating and outdoor routes for the season you will arrive. The moving checklist keeps those checks alongside the lease and arrival arrangements.
Buenos Aires temperatures and rainfall by month
Average daily maximum, SMN Buenos Aires Observatorio, 1991 to 2020. This is not a record-high chart.
Source 1
| Month | Average high | Average low | Mean temperature | Rainfall | Rain days |
|---|---|---|---|---|---|
| January | 30.1°C (86.2°F) | 20.2°C (68.4°F) | 24.9°C (76.8°F) | 134.4 mm | 7.5 |
| February | 28.9°C (84.0°F) | 19.4°C (66.9°F) | 23.8°C (74.8°F) | 129.3 mm | 6.8 |
| March | 27.0°C (80.6°F) | 17.7°C (63.9°F) | 22.0°C (71.6°F) | 120.0 mm | 6.7 |
| April | 23.2°C (73.8°F) | 14.1°C (57.4°F) | 18.2°C (64.8°F) | 130.3 mm | 7.1 |
| May | 19.4°C (66.9°F) | 11.1°C (52.0°F) | 14.8°C (58.6°F) | 93.5 mm | 5.2 |
| June | 16.4°C (61.5°F) | 8.4°C (47.1°F) | 12.0°C (53.6°F) | 61.5 mm | 4.9 |
| July | 15.5°C (59.9°F) | 7.5°C (45.5°F) | 11.0°C (51.8°F) | 74.4 mm | 5.6 |
| August | 17.9°C (64.2°F) | 8.9°C (48.0°F) | 13.0°C (55.4°F) | 70.3 mm | 4.9 |
| September | 19.7°C (67.5°F) | 10.6°C (51.1°F) | 14.9°C (58.8°F) | 80.6 mm | 5.8 |
| October | 22.6°C (72.7°F) | 13.4°C (56.1°F) | 17.9°C (64.2°F) | 122.9 mm | 7.9 |
| November | 26.0°C (78.8°F) | 16.1°C (61.0°F) | 20.9°C (69.6°F) | 117.6 mm | 7.2 |
| December | 29.0°C (84.2°F) | 18.5°C (65.3°F) | 23.6°C (74.5°F) | 122.8 mm | 6.9 |
Source 1
January has the highest average high at 30.1°C (86.2°F). July has the lowest average high at 15.5°C (59.9°F). This 14.6°C (26.3°F) difference is why a winter apartment inspection cannot stand in for a summer cooling check. Ask about the actual equipment and test it before signing.1
Rainfall and rain days answer different questions
Monthly total rainfall averaged across 1991 to 2020. A wet month can contain a few heavy storms rather than continuous rain.
Source 1
January has the highest average rain volume at 134.4 mm (5.3 in), while October has the most qualifying rain days at 7.9. June has the lowest rain volume at 61.5 mm (2.4 in). Buenos Aires therefore has a wetter summer pattern, but no month in this table supports a rain-free season.1
Take rain gear on apartment-viewing days and check the drainage around the entrance. A normal rain-day count does not establish the flood risk of an individual property. Use the city's live alerts and ask the building manager about prior water entry. The rent guide covers the wider inspection.2
The four seasons in Buenos Aires
Summer, December to February
Average highs run from 28.9 to 30.1°C (84.0 to 86.2°F). January nights average 20.2°C (68.4°F). Inspect cooling and sun exposure.
Fall, March to May
Average highs fall from 27.0 to 19.4°C (80.6 to 66.9°F). March remains warm, while May calls for warmer evening layers.
Winter, June to August
Average highs run from 15.5 to 17.9°C (59.9 to 64.2°F). July nights average 7.5°C (45.5°F), so heating matters.
Spring, September to November
Average highs rise from 19.7 to 26.0°C (67.5 to 78.8°F). October averages 7.9 rain days, so keep the viewing schedule flexible.
Source 1
The seasons run opposite to North America and Europe. A December arrival is a summer arrival. A July arrival is a winter arrival. Match the apartment inspection and packing to Buenos Aires conditions, rather than the season where you depart. For school timing, use the families guide before choosing a date.
Best time to move to Buenos Aires
March is our first weather-led recommendation for an apartment search. Its average high is 27.0°C (80.6°F), with 6.7 rain days. October is the runner-up, with a 22.6°C (72.7°F) average high but more rain days at 7.9. The school calendar or visa timing can outweigh this comfort judgment.1
| Arrival season | What makes the move easier | What to inspect |
|---|---|---|
| March or April | Lower heat than midsummer | Cooling, rain entry and the desk location |
| September or October | Moderate daytime temperatures | Wet-weather station route and warm layers |
| December to February | Longer outdoor daytime routine | Cooling operation, sun exposure and bedroom ventilation |
| June to August | Lower average rainfall volume | Heating, hot water and window seals |
Source 1
Read the moving checklist and Argentina visas before organizing the move around weather. A climate preference cannot establish entry permission or a school place. Confirm those fixed dates first, then choose a comfortable viewing week.
What to wear and pack for Buenos Aires
- Summer coolingBring light clothing and inspect how the apartment cools during the afternoon. January highs average 30.1°C (86.2°F).
- Winter layersPack a warm jacket and layers for evenings. July lows average 7.5°C (45.5°F).
- Rain gearKeep a compact umbrella or rain jacket accessible in every season. No month is rain-free in the normals.
- Comfortable shoesTest the station and grocery walks in the footwear you will use for daily errands.
- Seasonal desk comfortCheck sun glare and airflow for the room where you expect to work.
Source 1
For a remote-work move, inspect the desk room at its normal work hour. Cooling, heating and street noise affect calls as well as sleep. Compare actual utility and equipment arrangements through the cost of living guide, rather than assuming the advertised rent includes comfortable indoor conditions.
Normal temperatures are not extreme temperatures
| Measure | Recorded value | Date |
|---|---|---|
| Highest daily maximum in that period | 40.5°C (104.9°F) | December 18, 1995 |
| Lowest daily minimum in that period | -2.1°C (28.2°F) | August 1, 1991 |
| Largest daily precipitation in that period | 159.0 mm (6.3 in) | April 1, 2013 |
Source 1
Averages can hide heat, cold and intense rain. SMN publishes separate extreme-temperature alerts because the expected highs and lows can create health risks. Check the live alert category rather than assuming a 30-year average describes your arrival week. Use the healthcare guide for medical planning.4
Storms, flooding and live alerts
Buenos Aires includes intense rain and flooding from sudestada conditions in its emergency planning. The city's storm guidance routes public emergencies to 103. Follow official warnings and avoid flooded streets. The monthly rain table cannot show whether a specific basement, entrance or route will flood.2,
Check the official alert
Use SMN's live warning and the city's instructions before leaving for viewings or airport travel.
Inspect the property history
Ask the building manager about water entry, drainage and any prior storm repairs.
Change the route during flooding
Avoid flooded streets and follow the city's warning. Do not treat a normal route map as a live flood assessment.
Keep essential documents accessible
Follow the city's severe-alert advice and keep medicines, documents and a charged phone accessible.
- Sudestada
- A southeastern wind event associated with rising estuary water and potential flooding in the city's emergency planning.
- Alerta meteorológica
- An official weather warning. Check its live severity and the local instructions.
- Normal climatológica
- A long-term climate average, rather than a forecast for a particular day.
Heating, cooling and air-quality checks
A mild daytime winter average does not establish a warm apartment. Test heating and hot water, inspect window seals and ask how the cooling works in the bedroom. The normals show a seasonal need for both. Ask for actual equipment and utility terms before treating a furnished apartment as ready for every season.1
This page does not have a verified current annual air-pollution figure for Buenos Aires. It therefore does not score the city as clean or publish an unsupported asthma comparison. Use the city air-quality monitoring dataset for station-level evidence. For a personal respiratory plan, use the healthcare guide alongside medical advice.5
Questions people ask
What is Buenos Aires weather like by month?
January highs average 30.1°C (86.2°F), while July highs average 15.5°C (59.9°F). Rain occurs in every month of the SMN 1991 to 2020 normals. Use the monthly table for temperatures, rain volume and rain days.
Which Buenos Aires month has the hottest average weather?
January. Its average high is 30.1°C (86.2°F), average low 20.2°C (68.4°F) and mean 24.9°C (76.8°F) at Buenos Aires Observatorio. These are normals, rather than a forecast or a record.
Which Buenos Aires month has the coldest average weather?
July. It averages 15.5°C (59.9°F) by day and 7.5°C (45.5°F) for the daily low. Its mean is 11.0°C (51.8°F), so inspect heating for a winter apartment.
Does Buenos Aires have a dry season?
There is no rain-free month in the official normals. June has the lowest average rain volume at 61.5 mm (2.4 in). January is highest at 134.4 mm (5.3 in). Keep rain gear available throughout the year.
Which month has the most rain days in Buenos Aires?
October, at 7.9 days with at least 1 mm of rain. January has more rain by volume, at 134.4 mm (5.3 in). More rain days and more total rain are different measures.
What is the best weather-led month to move to Buenos Aires?
March is our first recommendation, with a 27.0°C (80.6°F) average high and 6.7 rain days. October is the runner-up. School, lease and immigration dates can outweigh that comfort judgment.
How much rain does Buenos Aires get in a year?
The published annual normal is 1,257.7 mm (49.5 in) for 1991 to 2020 at SMN Buenos Aires Observatorio. Rounded monthly values sum to 1,257.6 mm. That 0.1 mm difference comes from rounding.
Will I need heating in a Buenos Aires apartment?
Inspect it before a winter lease. July lows average 7.5°C (45.5°F), and the normals-period file includes freezing extremes. Check actual heating operation, hot water and window seals rather than relying on the daytime average.
Will I need air conditioning in a Buenos Aires apartment?
Test cooling for a summer arrival. January highs average 30.1°C (86.2°F), while nights average 20.2°C (68.4°F). Equipment, sun exposure and bedroom airflow determine the actual apartment comfort.
Do Buenos Aires climate averages predict my moving week?
No. The table uses official 1991 to 2020 normals for a long-term baseline. Check the live SMN forecast and weather or extreme-temperature alerts for your moving week.
What is a sudestada in Buenos Aires?
It is a southeastern wind event associated with rising estuary water and flood risk in the city's emergency planning. Use live official warnings for the current situation. A neighborhood map cannot establish a safe route during flooding.
Where should I check Buenos Aires storm alerts?
Use the official SMN service and the city's weather-alert instructions. The city routes public emergencies to 103. Avoid flooded streets and follow the live local guidance when a warning applies.
Are the extreme temperatures here all-time Buenos Aires records?
No. The source file reports extremes inside the 1991 to 2020 period. Its 40.5°C (104.9°F) high and -2.1°C (28.2°F) low are not claimed as all-time or current records.
Does this guide confirm Buenos Aires has clean air?
No current annual pollution figure has been verified for this page. Use the city's station monitoring dataset for air-quality evidence. A climate average cannot establish respiratory safety or the pollution around a particular apartment.
Plan your move
Get a free relocation plan for Buenos Aires.
Answer three questions and get your tasks in order, ready to print or save.
- Answer three questions
- Get your tasks in order
- Print it or save it
Our packages are available for moves to Santiago today. For other cities, we confirm providers, requirements, and fees before you pay.
Sources and how we check them
Sources and how we check them5 sources
Every figure on this page comes from the official or primary source listed here. We checked them in . Rules and prices change, so confirm anything important with the source before you act on it.
- Servicio Meteorológico Nacional, WMO 1991 to 2020 climate normals archived by NOAA (opens in a new tab)
- City of Buenos Aires, storm-alert instructions, checked October 9, 2026 (opens in a new tab)
- City of Buenos Aires, Defensa Civil emergency response, checked October 9, 2026 (opens in a new tab)
- Servicio Meteorológico Nacional, extreme-temperature warning system, checked October 9, 2026 (opens in a new tab)
- Buenos Aires Data, air-quality monitoring dataset, checked October 9, 2026 (opens in a new tab)
Hero photo by Beatrice Murch, CC BY 2.0 (opens in a new tab), from Wikimedia Commons (opens in a new tab).