

Weather in Córdoba by month
Weather in Córdoba by month
Córdoba has warm, wetter summers and cooler, dry winters. Choose heating and shade from the station record, then inspect the building.
- January high
- 31.2°C
- Mean daily maximum, 1991 to 2020
- July low
- 5.5°C
- Mean daily minimum
- Annual rain
- 815.6 mm
- Published annual normal
- Rain days
- 63.9 per year
- At least 1 mm rain
On this page
The short answer
Córdoba Observatorio's 1991 to 2020 normals show January daily highs averaging 31.2°C (88.2°F) and lows of 18.9°C (66.0°F). July averages 18.4°C (65.1°F) highs and 5.5°C (41.9°F) lows. Annual rainfall is 815.6 mm. These are city-station climate normals, rather than a current forecast. Summer cooling, winter heating and the exact apartment exposure deserve separate checks.
- January average highs reach 31.2°C (88.2°F).
- July average lows are 5.5°C (41.9°F).
- Annual normal rainfall is 815.6 mm.
- The record uses Observatorio station 87345, rather than the airport.
What the evidence can support
Monthly station normals
Tool
Córdoba by month
Córdoba Observatorio, 1991 to 2020 normals.
Average highs range from 65°F to 88°F. Rainfall peaks at 143.9 mm a month. NOAA SMN Córdoba Observatorio 87345 normal CSV (opens in a new tab)
| Month | High and low °C | Rain and days |
|---|---|---|
| January | 31.2 and 18.9 | 121.6 mm over 8.8 days |
| February | 29.4 and 17.8 | 126.6 mm over 8.4 days |
| March | 28.1 and 16.5 | 99.9 mm over 7.6 days |
| April | 25 and 13.3 | 61.2 mm over 5.6 days |
| May | 21.3 and 9.9 | 20.7 mm over 3.3 days |
| June | 19 and 6.4 | 6.7 mm over 1 days |
| July | 18.4 and 5.5 | 6.7 mm over 1.3 days |
| August | 21.5 and 7.4 | 8 mm over 1 days |
| September | 23.8 and 10 | 33.7 mm over 3.1 days |
| October | 26.3 and 13.4 | 76.9 mm over 5.9 days |
| November | 29.1 and 15.8 | 109.7 mm over 8.3 days |
| December | 31 and 18.1 | 143.9 mm over 9.6 days |
Source 2
Argentina's HIDDEN Gem - Córdoba Capital 🇦🇷 | Full Guide
The creator discusses his experience of the weather in 2024. Use the SMN station normals on this page for the measured climate.
A station normal is not an indoor temperature
Check the exposure
Ask which rooms receive afternoon sun and inspect curtains, shading and ventilation.
Test cooling
Run the actual cooling unit and ask who pays for servicing and replacement.
Check winter heating
Identify the heating fuel, safe ventilation and meter arrangement before relying on a July average.
Look for rain exposure
Inspect balconies, roof condition and visible damp. Ask for records of past leaks.
A mean daily maximum averages daily peaks across the reference period. It is not a temperature ceiling. The same applies to average winter lows. Building performance can differ from the outdoor station.2
Mountain plans need a separate forecast
The Observatorio record describes the city station. It cannot supply the current weather in La Cumbrecita or another mountain destination. Check the destination forecast and access conditions before departure.2,
Weather in Córdoba by month. Next practical checks
- Read Utilities in Córdoba to ask how the actual apartment handles summer cooling and winter heating.
- Read Rent prices in Córdoba to inspect ventilation and heating before choosing a home.
- Read Retiring in Córdoba to connect the seasonal climate with medical and mobility requirements.
- Read Living in Córdoba with children to check the school-day route under summer heat or rain.
- Read Weekend trips from Córdoba to check conditions for a mountain excursion before setting out.
- Read Accessibility in Córdoba to inspect wet surfaces and gradients along your planned route.
- Read Córdoba city guide to decide whether the measured seasonal range fits your daily routine.
Questions people ask
Which Córdoba weather station does the guide use?
SMN Córdoba Observatorio, WMO 87345. The NOAA-hosted source CSV contains the 1991 to 2020 normal. Airport station 87344 is a separate station.
What are Córdoba's average January highs?
31.2°C (88.2°F) is the mean daily maximum. It is an average across the normal period, rather than the hottest possible day.
What are Córdoba's average July lows?
5.5°C (41.9°F) is the mean daily minimum. Check the actual apartment heating rather than assuming a winter night stays above that average.
Which Córdoba normal month has the most rain?
December has 143.9 mm in this station table. A climate normal does not predict rainfall for a particular future December.
How many rainy days does Córdoba average each year?
The published annual normal is 63.9 days with at least 1 mm of precipitation. It excludes days below that threshold.
Does Córdoba's annual rainfall equal the rounded monthly sum?
It need not. The guide preserves the published annual column instead of replacing it with a sum of rounded monthly values.
Can Córdoba city normals predict La Cumbrecita weather?
No. A different destination and elevation need a separate current forecast. Check access and weather before a mountain trip.
Does the Córdoba climate tool show this week's forecast?
No. It displays the 1991 to 2020 normal. A current forecast requires a separate weather observation.
Plan your move
Get a free relocation plan for Córdoba.
Answer three questions and get your tasks in order, ready to print or save.
- Answer three questions
- Get your tasks in order
- Print it or save it
Our packages are available for moves to Santiago today. For other cities, we confirm providers, requirements, and fees before you pay.
Sources and how we check them
Sources and how we check them3 sources
Every figure on this page comes from the official or primary source listed here. We checked them in . Rules and prices change, so confirm anything important with the source before you act on it.
- BCRA, original October 8, 2026 USD exchange quote (opens in a new tab)
- NOAA SMN Córdoba Observatorio 87345 normal CSV (opens in a new tab)
- Provincial tourism La Cumbrecita destination profile (opens in a new tab)
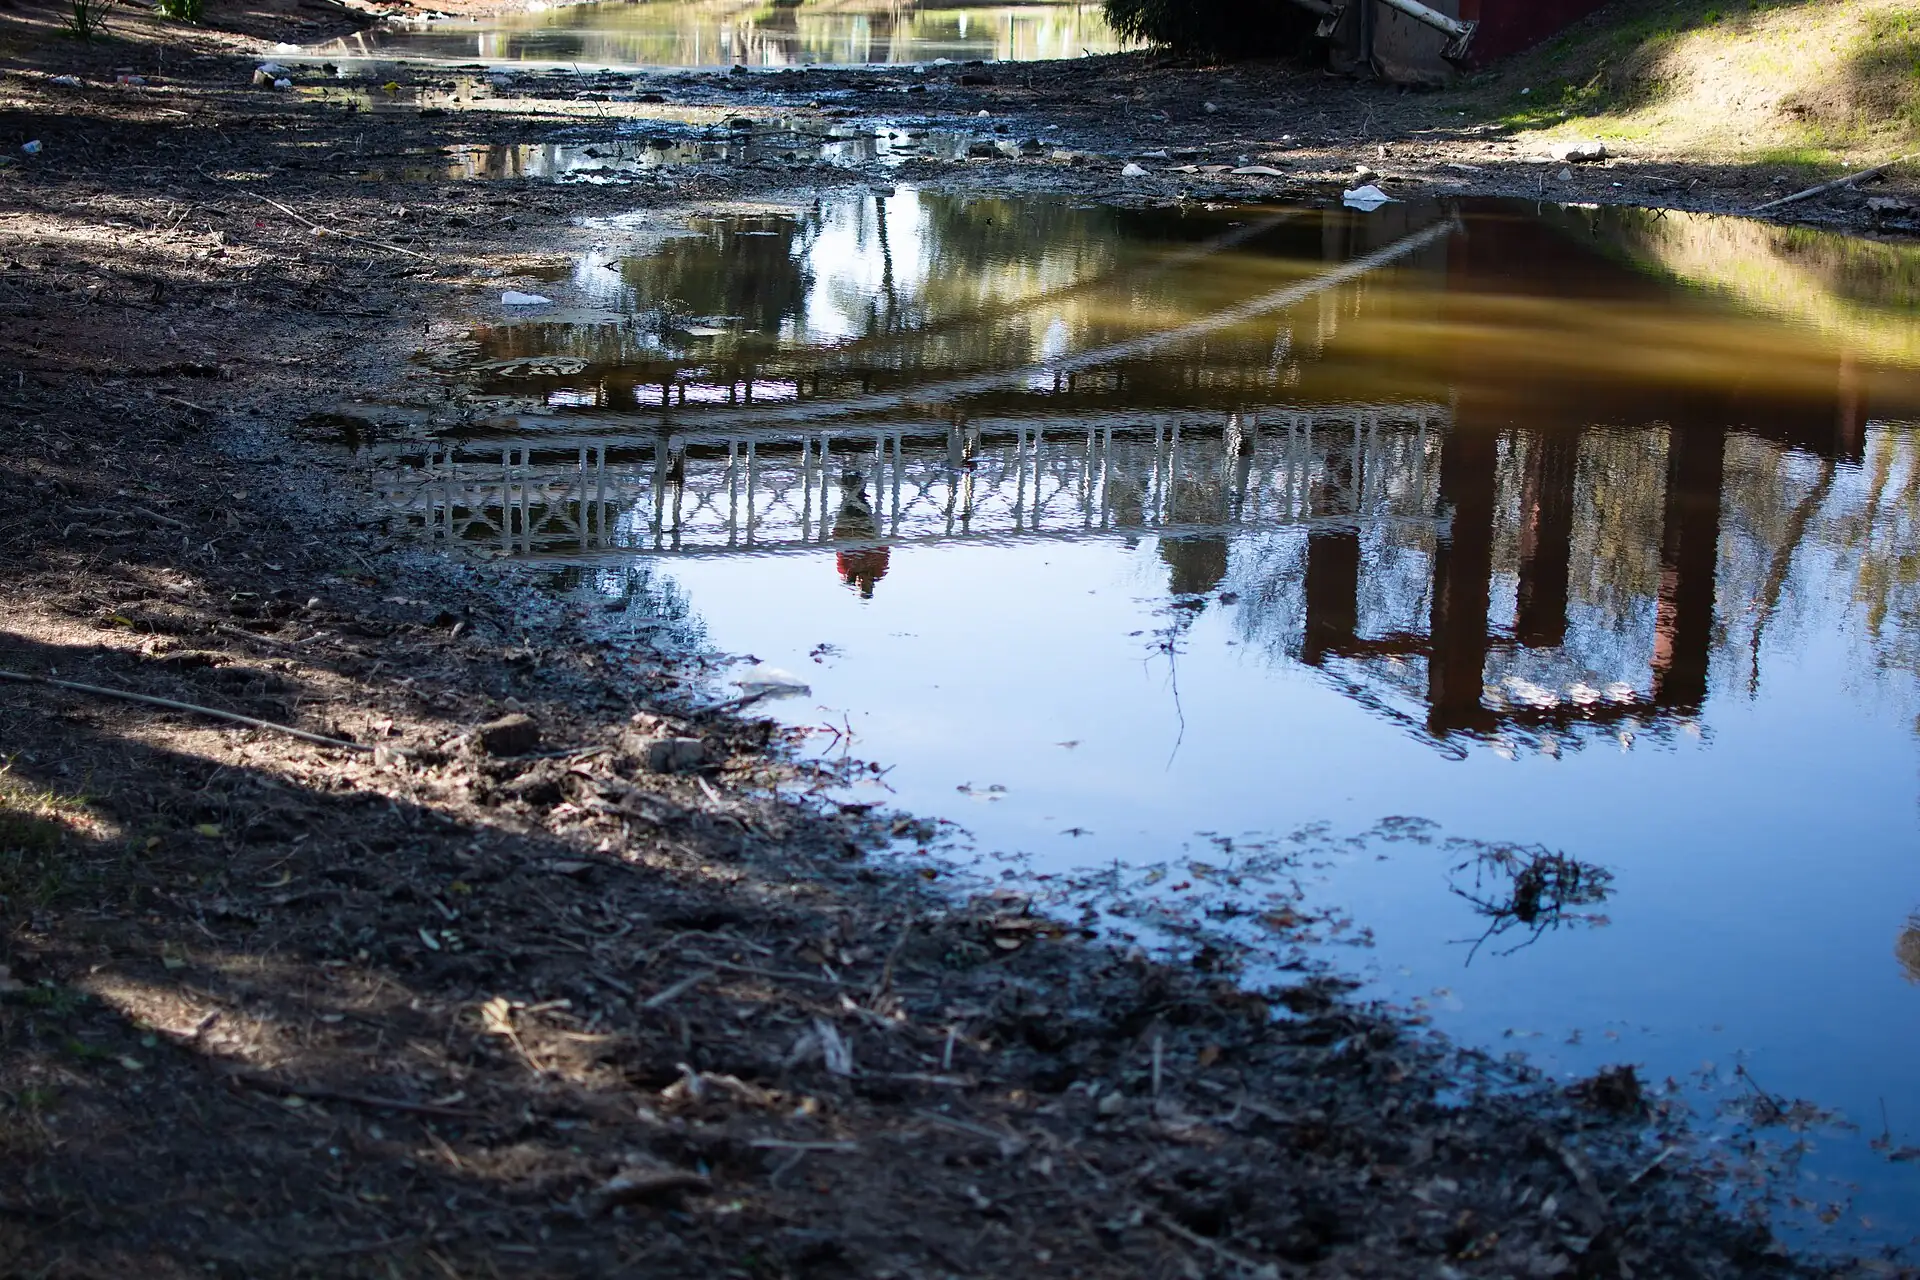
The lakebed and footbridge in Parque Sarmiento. Photograph dated 2019. Hero photo by Alegruttafoto, CC BY-SA 4.0 (opens in a new tab), from Wikimedia Commons (opens in a new tab).