

Rosario weather
Weather in Rosario
Historical airport normals help test seasonal comfort. They do not predict your arrival week or the temperature inside an apartment.
- Station
- Rosario Aero
- SMN station 0-20000-0-87480.
- Normal period
- 1991 to 2020
- Historical station observations.
- January daily high
- 30.9°C
- 87.6°F. Average daily maximum.
- July daily low
- 4.9°C
- 40.8°F. Average daily minimum.
On this page
The short answer
SMN's Rosario Aero 1991 to 2020 normals give January a mean of 24.8°C (76.6°F), with average highs of 30.9°C (87.6°F). July's mean is 10.1°C (50.2°F), with average lows of 4.9°C (40.8°F). Annual normal rainfall is 1,053.4 mm. Use this historical airport series to inspect cooling, heating, ventilation and drainage. It is not a current forecast or a measurement of every neighborhood.
- January's mean is 24.8°C (76.6°F).
- July's mean is 10.1°C (50.2°F).
- 1,053.4 mm is the annual rainfall normal.
- The actual home needs its own comfort inspection.
What does the normal seasonal pattern show?
Tool
Rosario by month
SMN Rosario Aero, WIGOS 0-20000-0-87480, 1991 to 2020 normals.
Average highs range from 62°F to 88°F. Rainfall peaks at 138.4 mm a month. SMN official climate normals 1991 to 2020 (opens in a new tab)
SMN Rosario Aero, 1991 to 2020. Monthly normals are historical station values.
Source 1
The airport station is 25 meters above sea level. Its measurements represent that site. A city-center room, shaded street or riverfront exposure may feel different.1
Normal highs and lows are not extremes
| Month | Average daily high | Average daily low |
|---|---|---|
| January | 30.9°C (87.6°F) | 18.7°C (65.7°F) |
| April | 23.9°C (75.0°F) | 12.4°C (54.3°F) |
| July | 16.5°C (61.7°F) | 4.9°C (40.8°F) |
| October | 24.3°C (75.7°F) | 12.3°C (54.1°F) |
Source 1
The retained period records 40.5°C (104.9°F) on January 9, 2006 and minus 8.4°C (16.9°F) on July 14, 2020. These are dated period extremes, not ordinary daily temperatures or a claim about all-time records.1
Inspect the room you will actually occupy
Test cooling
Check the installed equipment, windows, ventilation and the room used for work or sleep.
Test heating
Ask how the home is heated and inspect the condition and controls.
Review seasonal bills
Request actual electricity and gas statements rather than assigning a universal comfort cost.
Inspect weather exposure
Check drainage, leaks and the final outdoor route using the actual building.
Use Rent and Utilities to compare the equipment and bills. Remote work adds the desk room and meeting-hour test.
Use current forecasts for dated journeys
The normal series cannot settle a flight day, river excursion or school pickup forecast. Use a current forecast near travel and confirm operator conditions for Weekend trips.
Use Families for the child routine and Accessibility for the actual final walk. Neighborhoods provides geographic context without inventing a microclimate ranking.
Questions people ask
What is Rosario's summer like?
January's airport normal mean is 24.8°C (76.6°F), with an average daily high of 30.9°C (87.6°F). Check cooling in the actual home.
How cold is winter in Rosario?
July's mean is 10.1°C (50.2°F), with an average daily low of 4.9°C (40.8°F). The home's heating still needs inspection.
How much normal rainfall does the station record annually?
The 1991 to 2020 annual normal is 1,053.4 mm. That historical figure is not a forecast for the coming year.
Are these values a current forecast?
No. They are historical normals for Rosario Aero from 1991 to 2020.
Do average highs describe the hottest possible day?
No. The period's dated high reached 40.5°C (104.9°F). A normal daily maximum and an extreme answer different questions.
Does the dataset include verified rain-day counts?
No. This dataset supplies rainfall totals, not a rain-day series. Do not interpret missing rain-day values as zero.
Which neighborhood has the best climate?
No comparable neighborhood microclimate series was retained. Inspect sun, shade, ventilation and the actual room.
Does the budget include cooling and heating bills?
No complete utility quotation was retained. Use seasonal statements for the named home and current provider terms.
Plan your move
Get a free relocation plan for Rosario.
Answer three questions and get your tasks in order, ready to print or save.
- Answer three questions
- Get your tasks in order
- Print it or save it
Our packages are available for moves to Santiago today. For other cities, we confirm providers, requirements, and fees before you pay.
Sources and how we check them
Sources and how we check them1 sources
Every figure on this page comes from the official or primary source listed here. We checked them in . Rules and prices change, so confirm anything important with the source before you act on it.
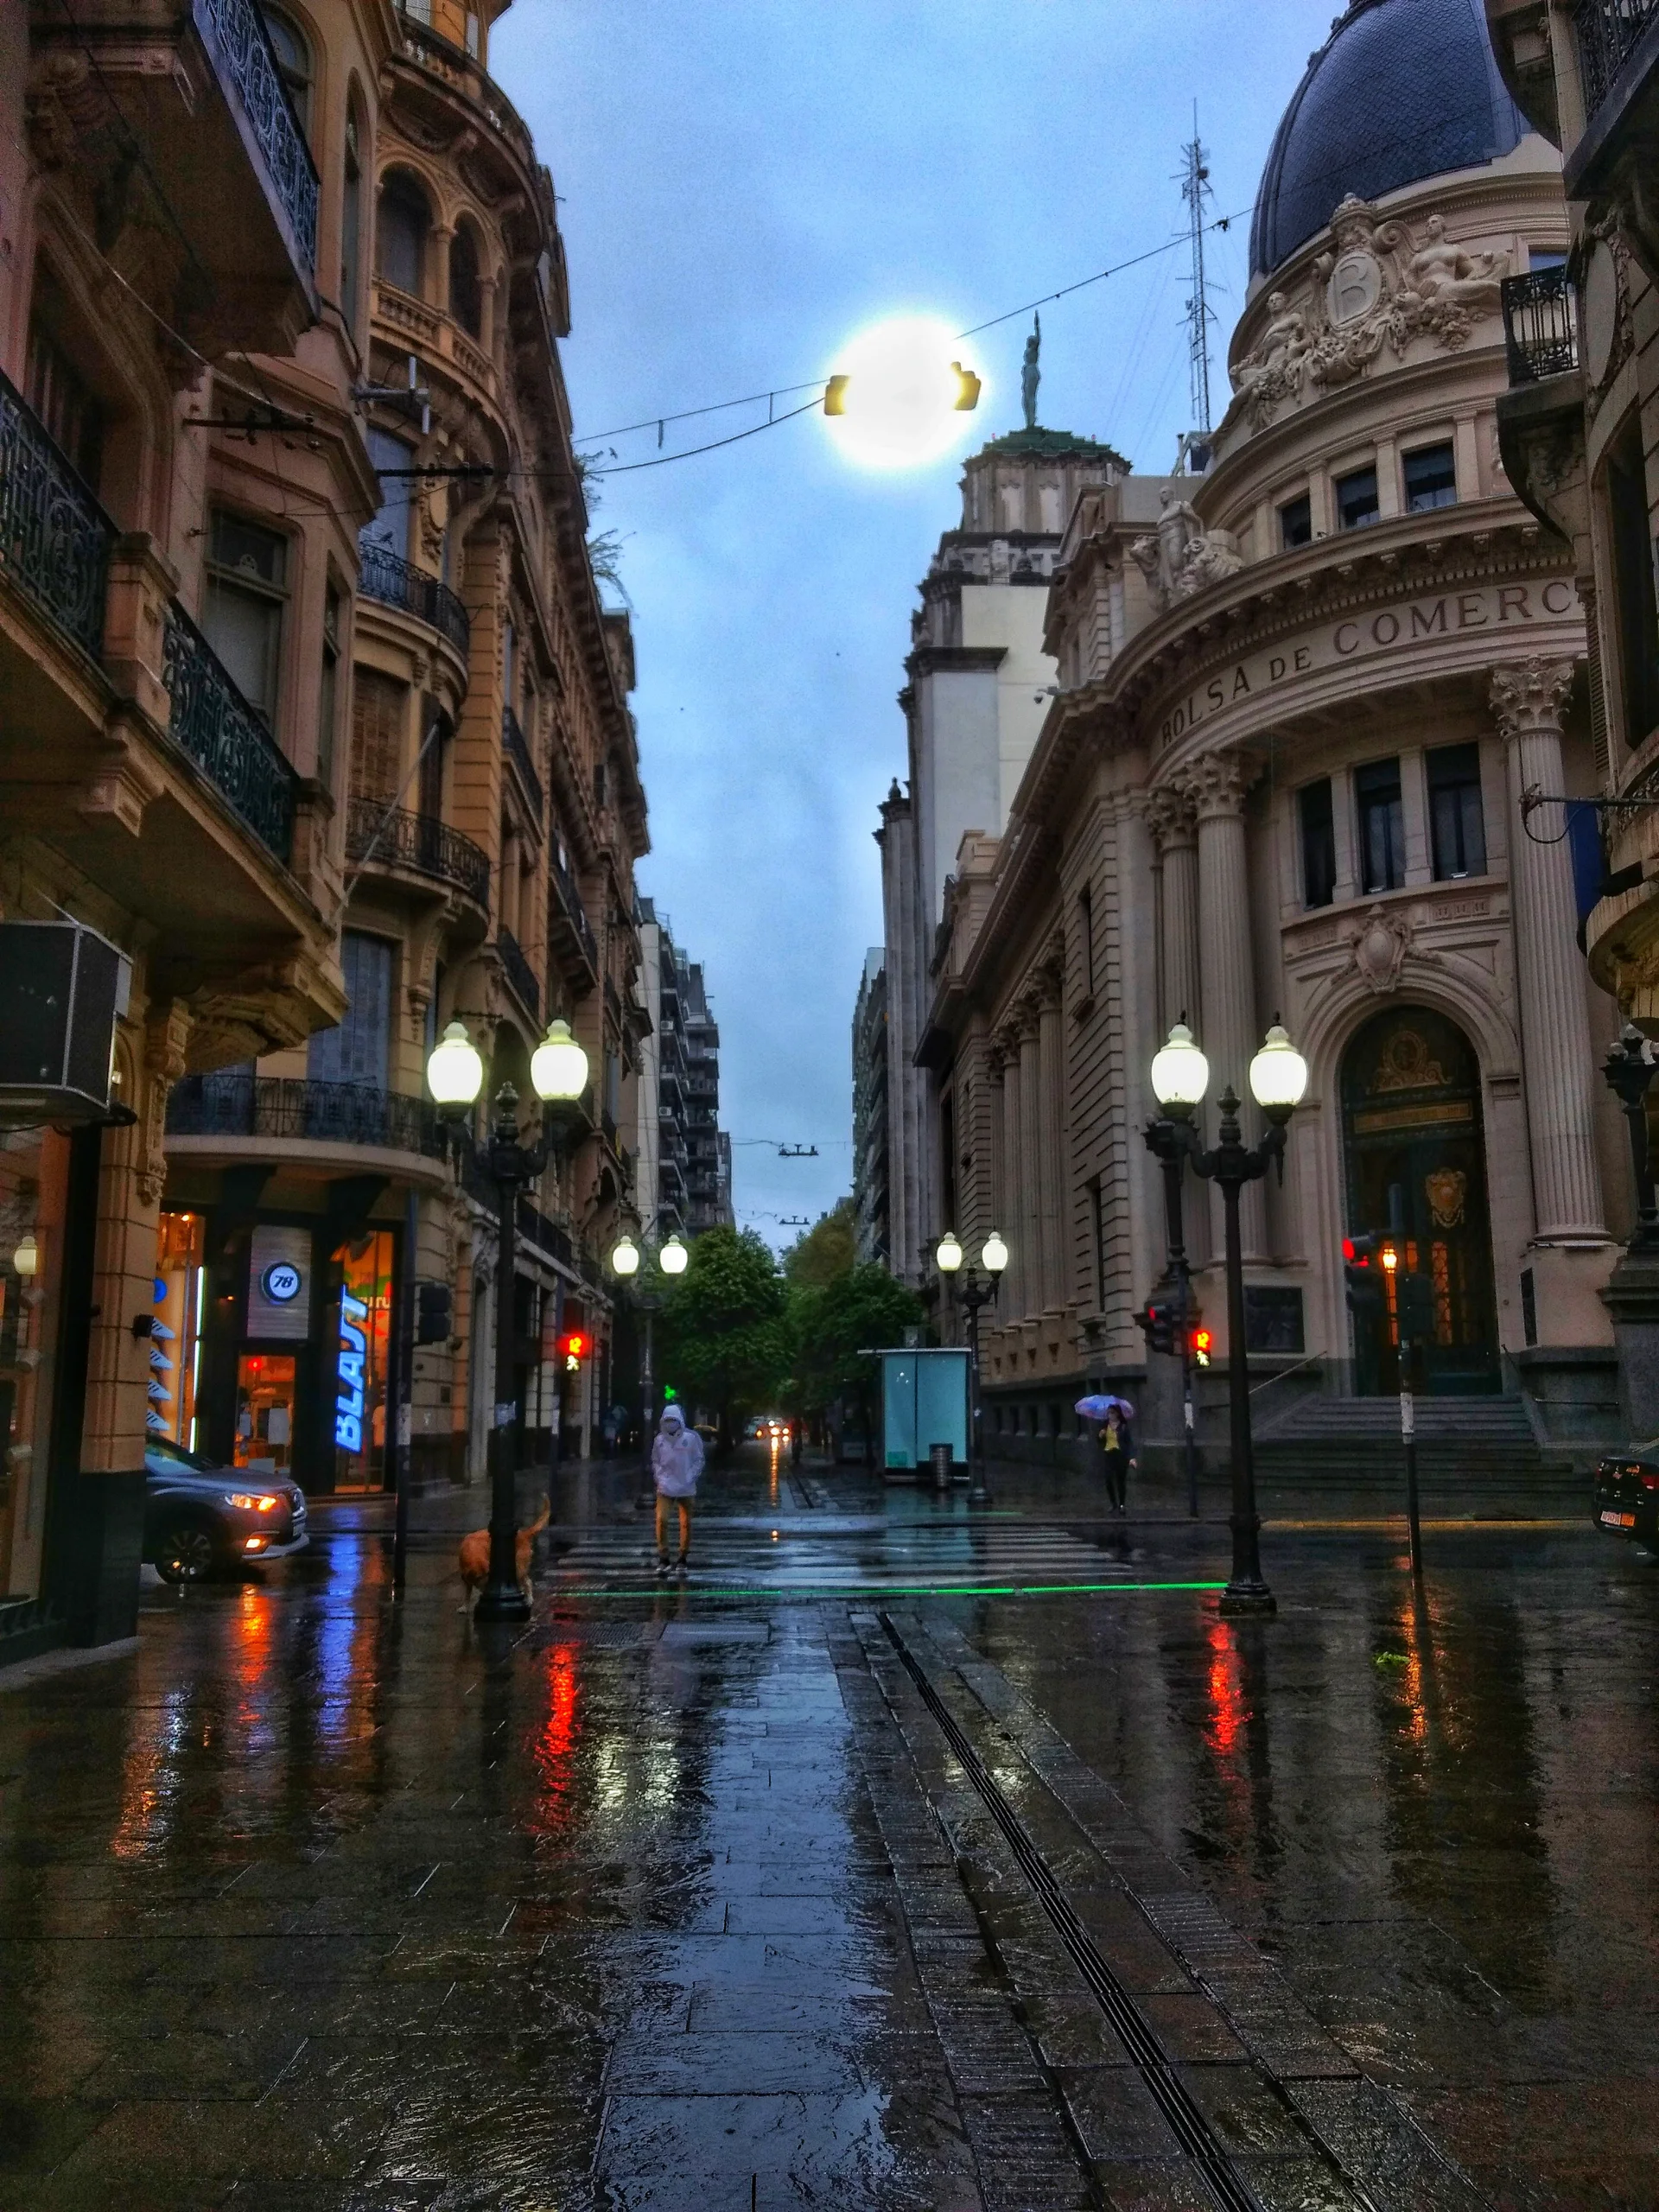
Cordoba Street on a rainy day, photographed on April 27, 2020. The historical scene illustrates wet-weather journeys. Station normals and current alerts come from separate official sources. Resized and converted to WebP. Hero photo by ElGuruCesar, CC BY-SA 4.0 (opens in a new tab), from Wikimedia Commons (opens in a new tab).