

Atibaia relocation guide
Weather in Atibaia
Try the rooms and final approach in useful conditions. A regional climate comparison helps plan the stay but cannot assess the individual home.
- Climate period
- 1991 to 2020
- Calculated from original daily model estimates.
- Data type
- Regional model grid
- Not a local weather station.
- July average low
- 10.5°C (51°F)
- Daily-low average, not a minimum extreme.
- Civil Defense
- 199
- Municipal emergency contact.
On this page
The short answer
Atibaia's regional comparison shows a useful seasonal change in nights and rainfall. July's modeled average daily low is 10.5°C (51°F), while January has 246.4 millimeters of average monthly rain in this calculation. Check the actual sleeping room, damp, drainage and approach during the first stay. For Pedra Grande, use current conditions and authority advice rather than a monthly chart.
- The climate comparison covers 1991 to 2020.
- These are NASA regional modeled estimates, not a local station.
- Test the actual room, drainage and home approach.
- Use current conditions for mountain outings.
Our take
Read the regional comparison with its proper scope
Tool
Atibaia by month
MERRA2 model grid, not a station, 1991 to 2020 normals.
Average highs range from 72°F to 82°F. Rainfall peaks at 246.4 mm a month. NASA POWER, 1991 to 2020 daily MERRA2 grid estimates (opens in a new tab)
The chart calculates 1991 to 2020 averages from original NASA POWER daily MERRA2 estimates around the Atibaia city reference point. It gives equal weight to thirty year-specific monthly daily-high means, daily-low means and rainfall totals. The native regional grid is 0.5 degrees latitude by 0.625 degrees longitude.1,
These are regional modeled estimates, not local weather-station normals, an issued INMET normal, home measurements or a forecast. The returned coordinates identify the request point rather than a measured station or exact grid boundary. Use current forecasts and local warnings for the dates you choose.1,
Test cool nights and the room you will use
July's modeled daily-low average is 10.5°C (51°F); January's is 17.9°C (64°F). Those monthly averages are not the coldest possible nights. Inspect windows, airflow, damp and bedding, and ask how the actual bedroom feels during cooler weather.1
Giglio advertises air conditioning in the suite. Run the actual equipment, ask about maintenance and read recent electricity bills. Check the work room separately from the bedroom. A feature in a rental advertisement does not establish comfort or energy use for the household.6,
Inspect the entrance and drainage
January's calculated monthly rainfall is 246.4 millimeters and August's is 31.2 millimeters. Every month in this comparison has rainfall. Inspect drains, runoff, visible water entry and the final approach, then ask the owner about past repairs and interruptions.1,
Atibaia's Civil Defense FAQ names flooding, landslides, cracks and dangerous trees among reasons to seek help, with emergency contact 199. Follow current local warnings and avoid floodwater. A long-term regional total does not assess a property's flood or slope risk.5,
Choose the day for the actual outing
Pedra Grande's state page publishes visitor hours and access restrictions. Contact the site about current conditions before traveling, especially when the weather changes. Confirm the approach and return rather than treating a scenic photograph as evidence of usable access.9,
Keep weekends, safety, utilities and remote work beside the first-stay plan. A useful trial includes an ordinary working day and the rooms where you will actually live.8,
Questions people ask
Are these local weather-station normals?
No. They are 1991 to 2020 averages calculated from NASA POWER daily MERRA2 regional modeled estimates around the requested Atibaia point.
Does July's average low establish the coldest night?
No. It is an average of daily lows, not a minimum extreme. Check the actual bedroom, windows, damp and bedding for the stay.
Does August's lower rainfall mean no rain?
No. Every month in this comparison has rainfall. Use the current forecast and local warnings for the actual day.
Can the chart certify Pedra Grande access?
No. Confirm current conditions, the approach and visitor instructions with the site before traveling.
Plan your move
Get a free relocation plan for Atibaia.
Answer three questions and get your tasks in order, ready to print or save.
- Answer three questions
- Get your tasks in order
- Print it or save it
Our packages are available for moves to Santiago today. For other cities, we confirm providers, requirements, and fees before you pay.
Sources and how we check them
Sources and how we check them11 sources
Every figure on this page comes from the official or primary source listed here. We checked them in . Rules and prices change, so confirm anything important with the source before you act on it.
- NASA POWER, 1991 to 2020 daily MERRA2 grid estimates (opens in a new tab)
- NASA POWER, MERRA2 meteorological methodology and spatial resolution (opens in a new tab)
- NASA POWER, daily API parameters and local solar time (opens in a new tab)
- NASA POWER, daily maximum and minimum temperature assessment (opens in a new tab)
- UK FCDO, Brazil safety and security guidance (opens in a new tab)
- CM Imóveis, Residencial Giglio rental 1918, Vila Petrópolis (opens in a new tab)
- Neoenergia Elektro, São Paulo residential account-holder change (opens in a new tab)
- Atibaia, current municipal questions on schools, care, transport and services (opens in a new tab)
- São Paulo protected-area guide, MONA Pedra Grande visitor information (opens in a new tab)
- Wikimedia Commons, Paulo César Prezoto de Barros Pedra Grande image and license (opens in a new tab)
- Atual Telecom, residential offers and exact-address coverage conditions (opens in a new tab)
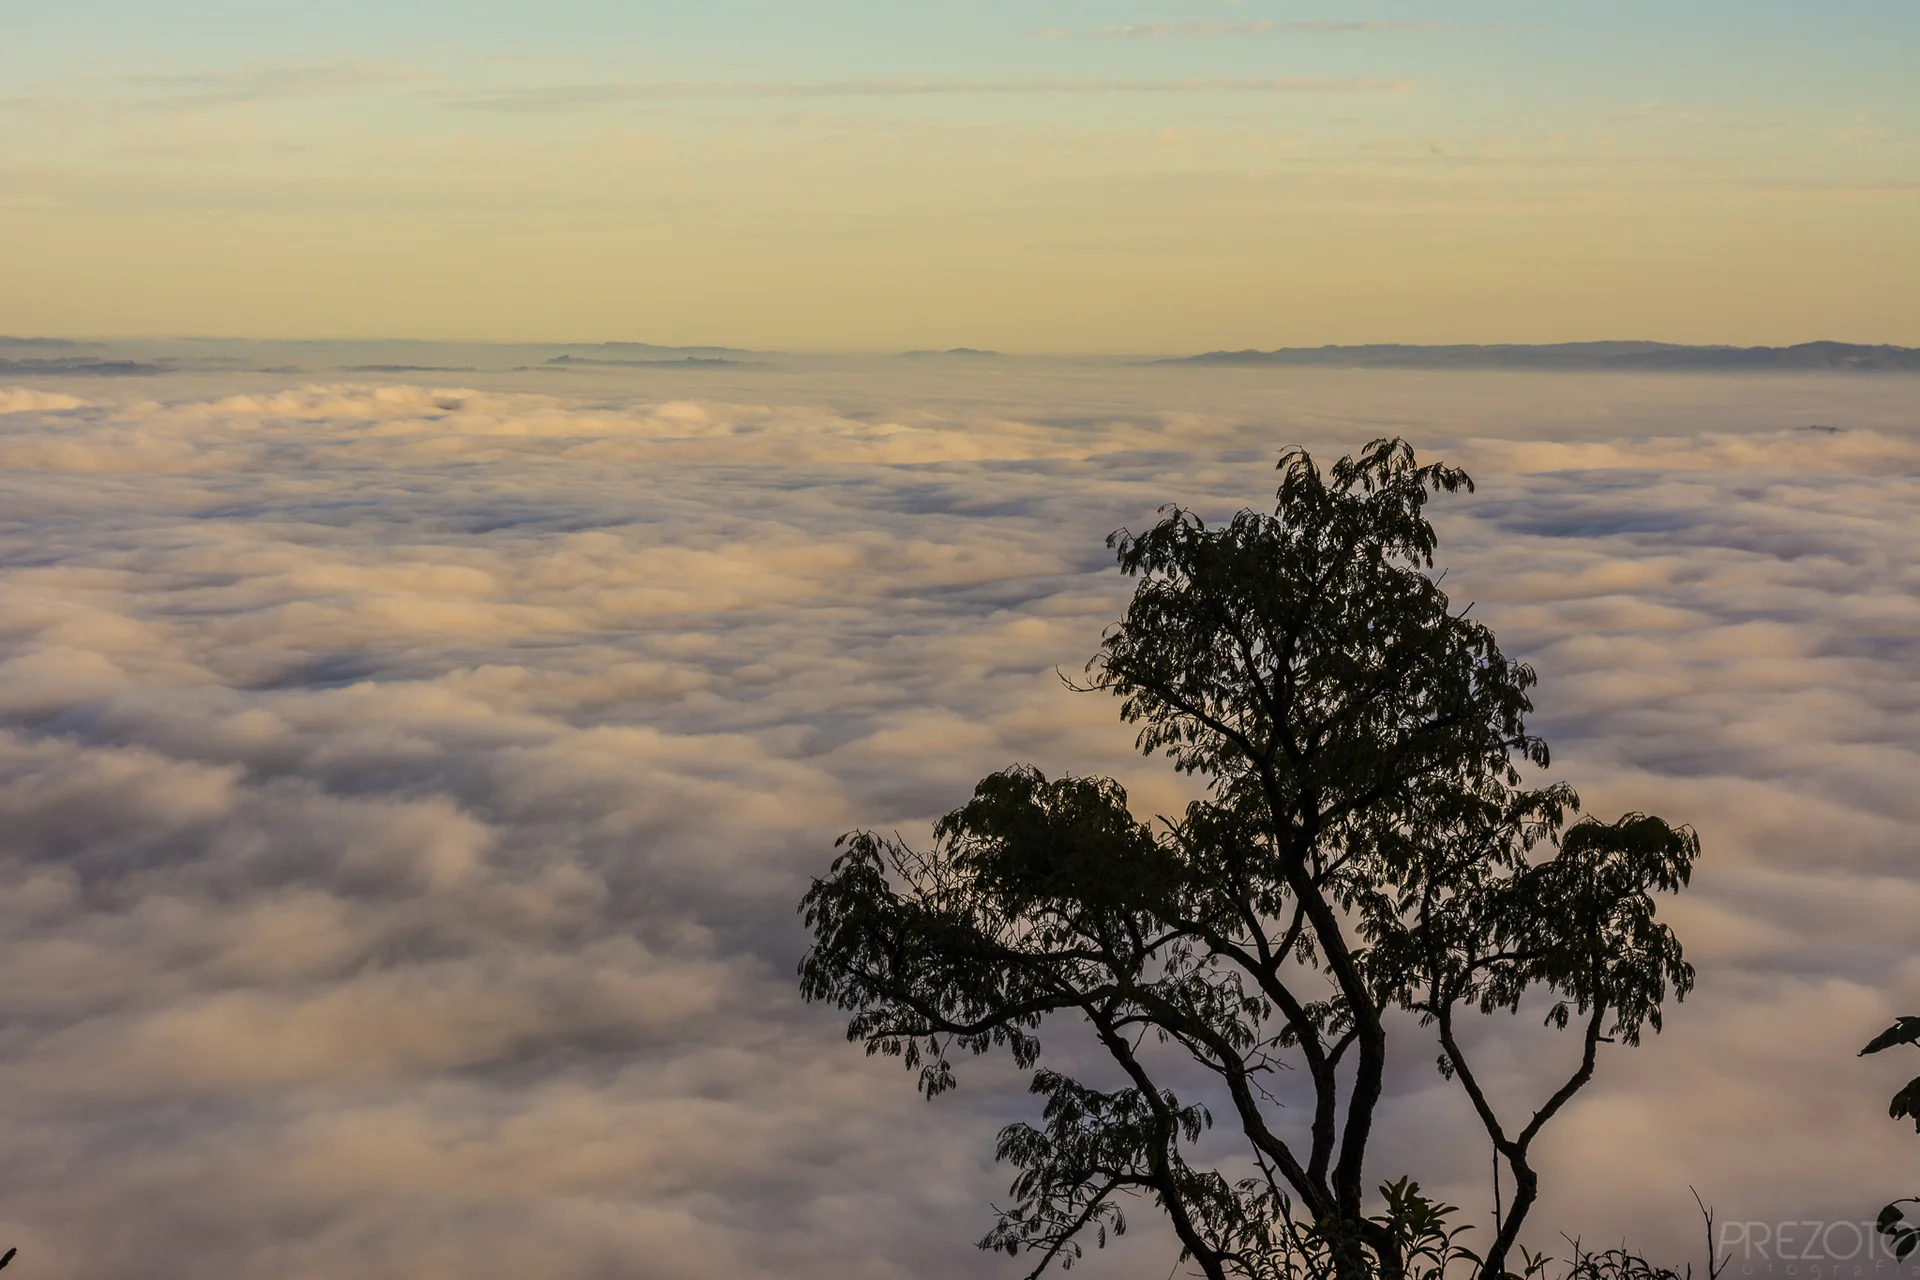
Pedra Grande, Atibaia. Historical scenery from the licensed photograph, not current weather, access or trail conditions. Hero photo by Paulo César Prezoto de Barros, CC BY 2.0 (opens in a new tab), from Wikimedia Commons (opens in a new tab).