

Arraial d'Ajuda relocation guide
Weather in Arraial d'Ajuda
Choose the home for warm days and rain as well as a beach visit. Check the working room, sleeping comfort and road approach in ordinary conditions.
- Climate period
- 1991 to 2020
- Calculated from daily modeled estimates.
- Data type
- Regional model grid
- Not a village station or home measurement.
- Rain planning
- Every month
- All months have rainfall in the calculation.
- Home check
- Cooling and drainage
- Inspect the actual rooms and entrance.
On this page
The short answer
The modeled climate comparison shows warmer average daily highs early in the year and cooler conditions around July. Rain appears throughout the year, with the largest monthly total in this dataset in November. Use that broad pattern to plan a useful stay. Then inspect the home's cooling, ventilation, damp and final approach. A monthly average cannot tell you whether a particular road or beach will be usable on the day.
- The chart uses modeled grid estimates, not a village station.
- The comparison covers 1991 to 2020.
- Rain appears in every month of the dataset.
- Inspect the actual home and road after rain.
Our take
Compare the long-term pattern
Tool
Arraial d'Ajuda by month
MERRA2 model grid, not a station, 1991 to 2020 normals.
Average highs range from 80°F to 91°F. Rainfall peaks at 172.5 mm a month. NASA POWER, 1991 to 2020 daily MERRA2 grid estimates (opens in a new tab)
The chart uses NASA POWER daily MERRA2 model estimates for 1991 to 2020, requested at the town reference coordinate. Highs and lows average each year's monthly daily values, then give each of the 30 years equal weight. Rainfall averages the 30 monthly totals. All daily values are present for the calculation.1,
NASA describes a native meteorological grid of 0.5 degrees latitude by 0.625 degrees longitude. These are regional model estimates around Arraial, with an area-average surface. They are not measurements at a village weather station, a home thermometer or a forecast. The coast and an individual home can differ.4
In this calculation, February's average daily high is 91°F (32.5°C), while July's is 80°F (26.6°C). Mean monthly rainfall is 172.5 millimeters in November and 62.2 millimeters in September. The lower-rain month still needs a rain plan.1
Inspect the warm working and sleeping rooms
The selected Novo apartment advertises air conditioning. Run the actual equipment and ask for recent power bills, maintenance responsibility and the home's usual cooling pattern. Check airflow, shade and damp in the rooms you will use, rather than judging comfort from the photograph.5,
Work from the proposed room at your normal time, and visit the sleeping room when it will matter. If the connection, cooling or pump depends on electricity, decide how a disruption affects the household. Remote work and utilities turn that into practical checks.5,
Check the home approach after rain
A February 26, 2026 municipal report said Estrada da Balsa had avoided flooding during the previous night's rain after cleaning work. It also said definitive drainage work was still being planned. Read that as one dated road report, then inspect your entrance, drainage and access independently.8
Ask the owner about past water entry, repairs and where runoff collects. Walk the route you will use for school, groceries and the ferry. Follow current local warnings and avoid crossing floodwater.8,
Plan the outing for the day's conditions
Ocean currents and warning flags matter on a beach day. Ask locally about the actual conditions and lifeguard advice before entering the water. The historical photograph and climate chart do not certify swimming or beach access.9,
Check Eco Parque's operating calendar and rules for the chosen date. For the municipal trail, confirm the present entrance and condition before walking. Use weekends, safety and where to live alongside the forecast.9,
Questions people ask
Are these local weather-station normals?
No. The chart is a 1991 to 2020 calculation from NASA POWER daily MERRA2 grid estimates around the requested town coordinate. It describes modeled regional conditions.
Does a lower-rain month mean no rain?
No. Every month in this dataset has rainfall. Check the current forecast and the road or outing conditions for your actual dates.
What should I check about air conditioning?
Run the actual unit, ask about maintenance and read recent electricity bills. Compare the room's shade, airflow and comfort at the hours you use it.
Does the Estrada da Balsa report prove my home avoids flooding?
No. It describes one night and planned further drainage work. Inspect your own entrance, ask about past water entry and follow current warnings.
Plan your move
Get a free relocation plan for Arraial d'Ajuda.
Answer three questions and get your tasks in order, ready to print or save.
- Answer three questions
- Get your tasks in order
- Print it or save it
Our packages are available for moves to Santiago today. For other cities, we confirm providers, requirements, and fees before you pay.
Sources and how we check them
Sources and how we check them13 sources
Every figure on this page comes from the official or primary source listed here. We checked them in . Rules and prices change, so confirm anything important with the source before you act on it.
- NASA POWER, 1991 to 2020 daily MERRA2 grid estimates (opens in a new tab)
- NASA POWER, daily API parameters and local solar time (opens in a new tab)
- NASA POWER, daily maximum and minimum temperature assessment (opens in a new tab)
- NASA POWER, MERRA2 meteorological methodology and spatial resolution (opens in a new tab)
- Cores da Bahia Imóveis, Novo Arraial ground-floor apartment, offer 46 (opens in a new tab)
- Neoenergia Coelba, Bahia account-holder change procedure (opens in a new tab)
- IGP Fibra, current linked residential offers and service terms (opens in a new tab)
- Porto Seguro, Estrada da Balsa drainage, February 26, 2026 (opens in a new tab)
- UK FCDO, Brazil safety and security guidance (opens in a new tab)
- Travessia das Balsas, published crossing schedule and card categories (opens in a new tab)
- Wikimedia Commons, Raul Golinelli beach photo and CC BY-SA 3.0 license (opens in a new tab)
- Arraial d'Ajuda Eco Parque, categories, calendar and contacts (opens in a new tab)
- Porto Seguro, Trilha Ecológica opening, February 10, 2023 (opens in a new tab)
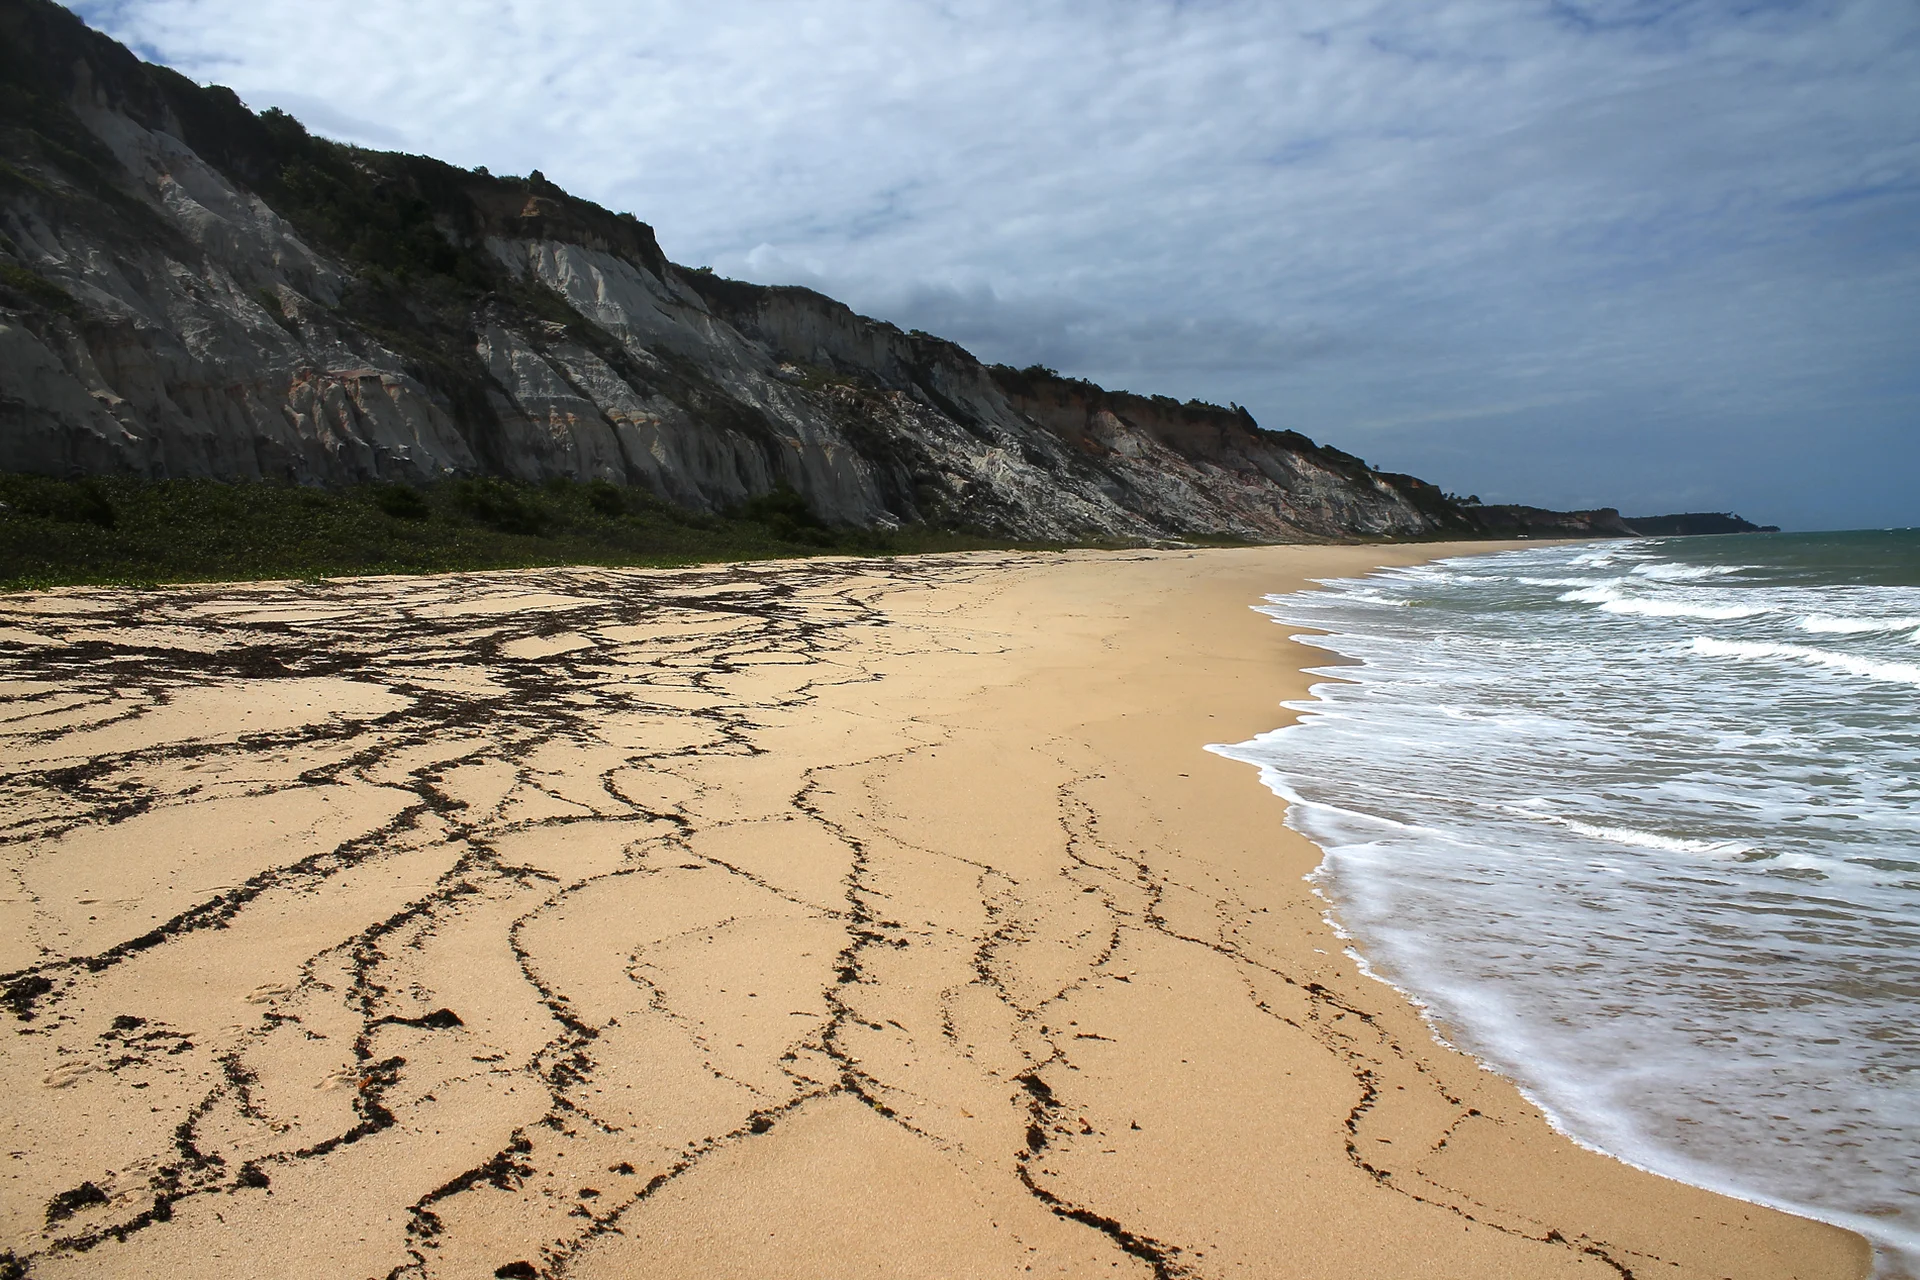
Arraial d'Ajuda beach and cliffs, photographed November 9, 2013. Historical place context, not current swimming or access conditions. Hero photo by Raul Golinelli, CC BY-SA 3.0 (opens in a new tab), from Wikimedia Commons (opens in a new tab).