

Bariloche weather
Weather in Bariloche
Check heating and winter access before letting summer lake scenery decide the move.
- Station
- Bariloche Aero
- 835 meters above sea level.
- Wettest reference month
- June
- 168.3 mm in the 1991 to 2020 normals.
On this page
The short answer
Bariloche Aero normals show a January average high of 23.2°C (73.8°F) and a July average low of -1.6°C (29.1°F). June has the highest monthly rainfall in this reference, at 168.3 mm. These are 1991 to 2020 station normals at 835 meters, not a forecast or an exact measurement for your chosen lake or hillside address.
- 1991 to 2020. Airport-station climate normals.
- 168.3 mm. June monthly rainfall in the retained table.
- 18.8 frost days. July station average.
- Address matters. Heating, exposure and access need separate checks.
How the seasons compare
Tool
Bariloche by month
Bariloche Aero, 1991 to 2020 normals.
Average highs range from 44°F to 74°F. Rainfall peaks at 168.3 mm a month. SMN 1991 to 2020 station normals (opens in a new tab)
| Month | Average high | Average low | Rainfall |
|---|---|---|---|
| January | 23.2°C (73.8°F) | 7°C (44.6°F) | 23.6 mm |
| June | 7.2°C (45.0°F) | -0.5°C (31.1°F) | 168.3 mm |
| July | 6.7°C (44.1°F) | -1.6°C (29.1°F) | 126.4 mm |
Source 1
Test the winter home
Request cold-month bills through the heating and utility checks. Inspect the advertised home for the heating system and exposure. Check the entrance and street route under the conditions you expect to use them.
Use the full map to distinguish an urban address from a western or Coihues location. Check the actual bus route and test your routine during the season you will live here.
South America Adventure| Part 1: Skiing in Bariloche + Viral Steak & Chocolate Shops
This February 2026 upload covers a skiing visit and city food. The filming date does not establish typical weather.
Treat mountain conditions separately
Before a park outing, check current weather alerts, closures and trekking registration. Keep the emergency contacts and avoid treating an airport normal as permission to enter a trail.3
Questions people ask
What does the Bariloche weather chart measure?
It shows average monthly high and low temperatures and rainfall at Bariloche Aero for 1991 to 2020. The station is at 835 meters. It does not measure every neighborhood or provide a forecast.
Which month has the highest average high in these normals?
January has the highest retained average high at 23.2°C (73.8°F). February is close at 23.1°C (73.6°F). These are average daily highs, not record temperatures.
Which month has the lowest average low?
July has an average low of -1.6°C (29.1°F). That figure is a monthly station average rather than the coldest possible night.
When is rainfall highest in the station table?
June averages 168.3 mm across the reference period. July averages 126.4 mm. These monthly totals do not determine the weather on a booked weekend.
Does the dataset measure how often frost occurs?
Yes. The retained July reference has 18.8 frost days and August has 16.9. The chart does not infer snow depth, road traction or a particular house's exposure.
Is a complete winter heating bill available?
No. A current electricity component tariff is retained, but a complete independently checked winter household bill is not. Ask the property owner for actual cold-month invoices.
Can the airport normals predict conditions at Llao Llao?
No exact address prediction is established. Use the normals as a reference, then investigate the home's lake, hillside and road setting and check current conditions.
Does a dry-looking monthly normal mean trekking is open?
No. Park instructions require registration, marked trails and checks for current weather alerts and closures. A seasonal average does not establish access on a particular day.
Plan your move
Get a free relocation plan for Bariloche.
Answer three questions and get your tasks in order, ready to print or save.
- Answer three questions
- Get your tasks in order
- Print it or save it
Our packages are available for moves to Santiago today. For other cities, we confirm providers, requirements, and fees before you pay.
Sources and how we check them
Sources and how we check them3 sources
Every figure on this page comes from the official or primary source listed here. We checked them in . Rules and prices change, so confirm anything important with the source before you act on it.
- SMN official climate normals 1991 to 2020 (opens in a new tab)
- CEB actual electricity tariff table September October 2026 (opens in a new tab)
- Nahuel Huapi park official mountain registration and safety recommendations (opens in a new tab)
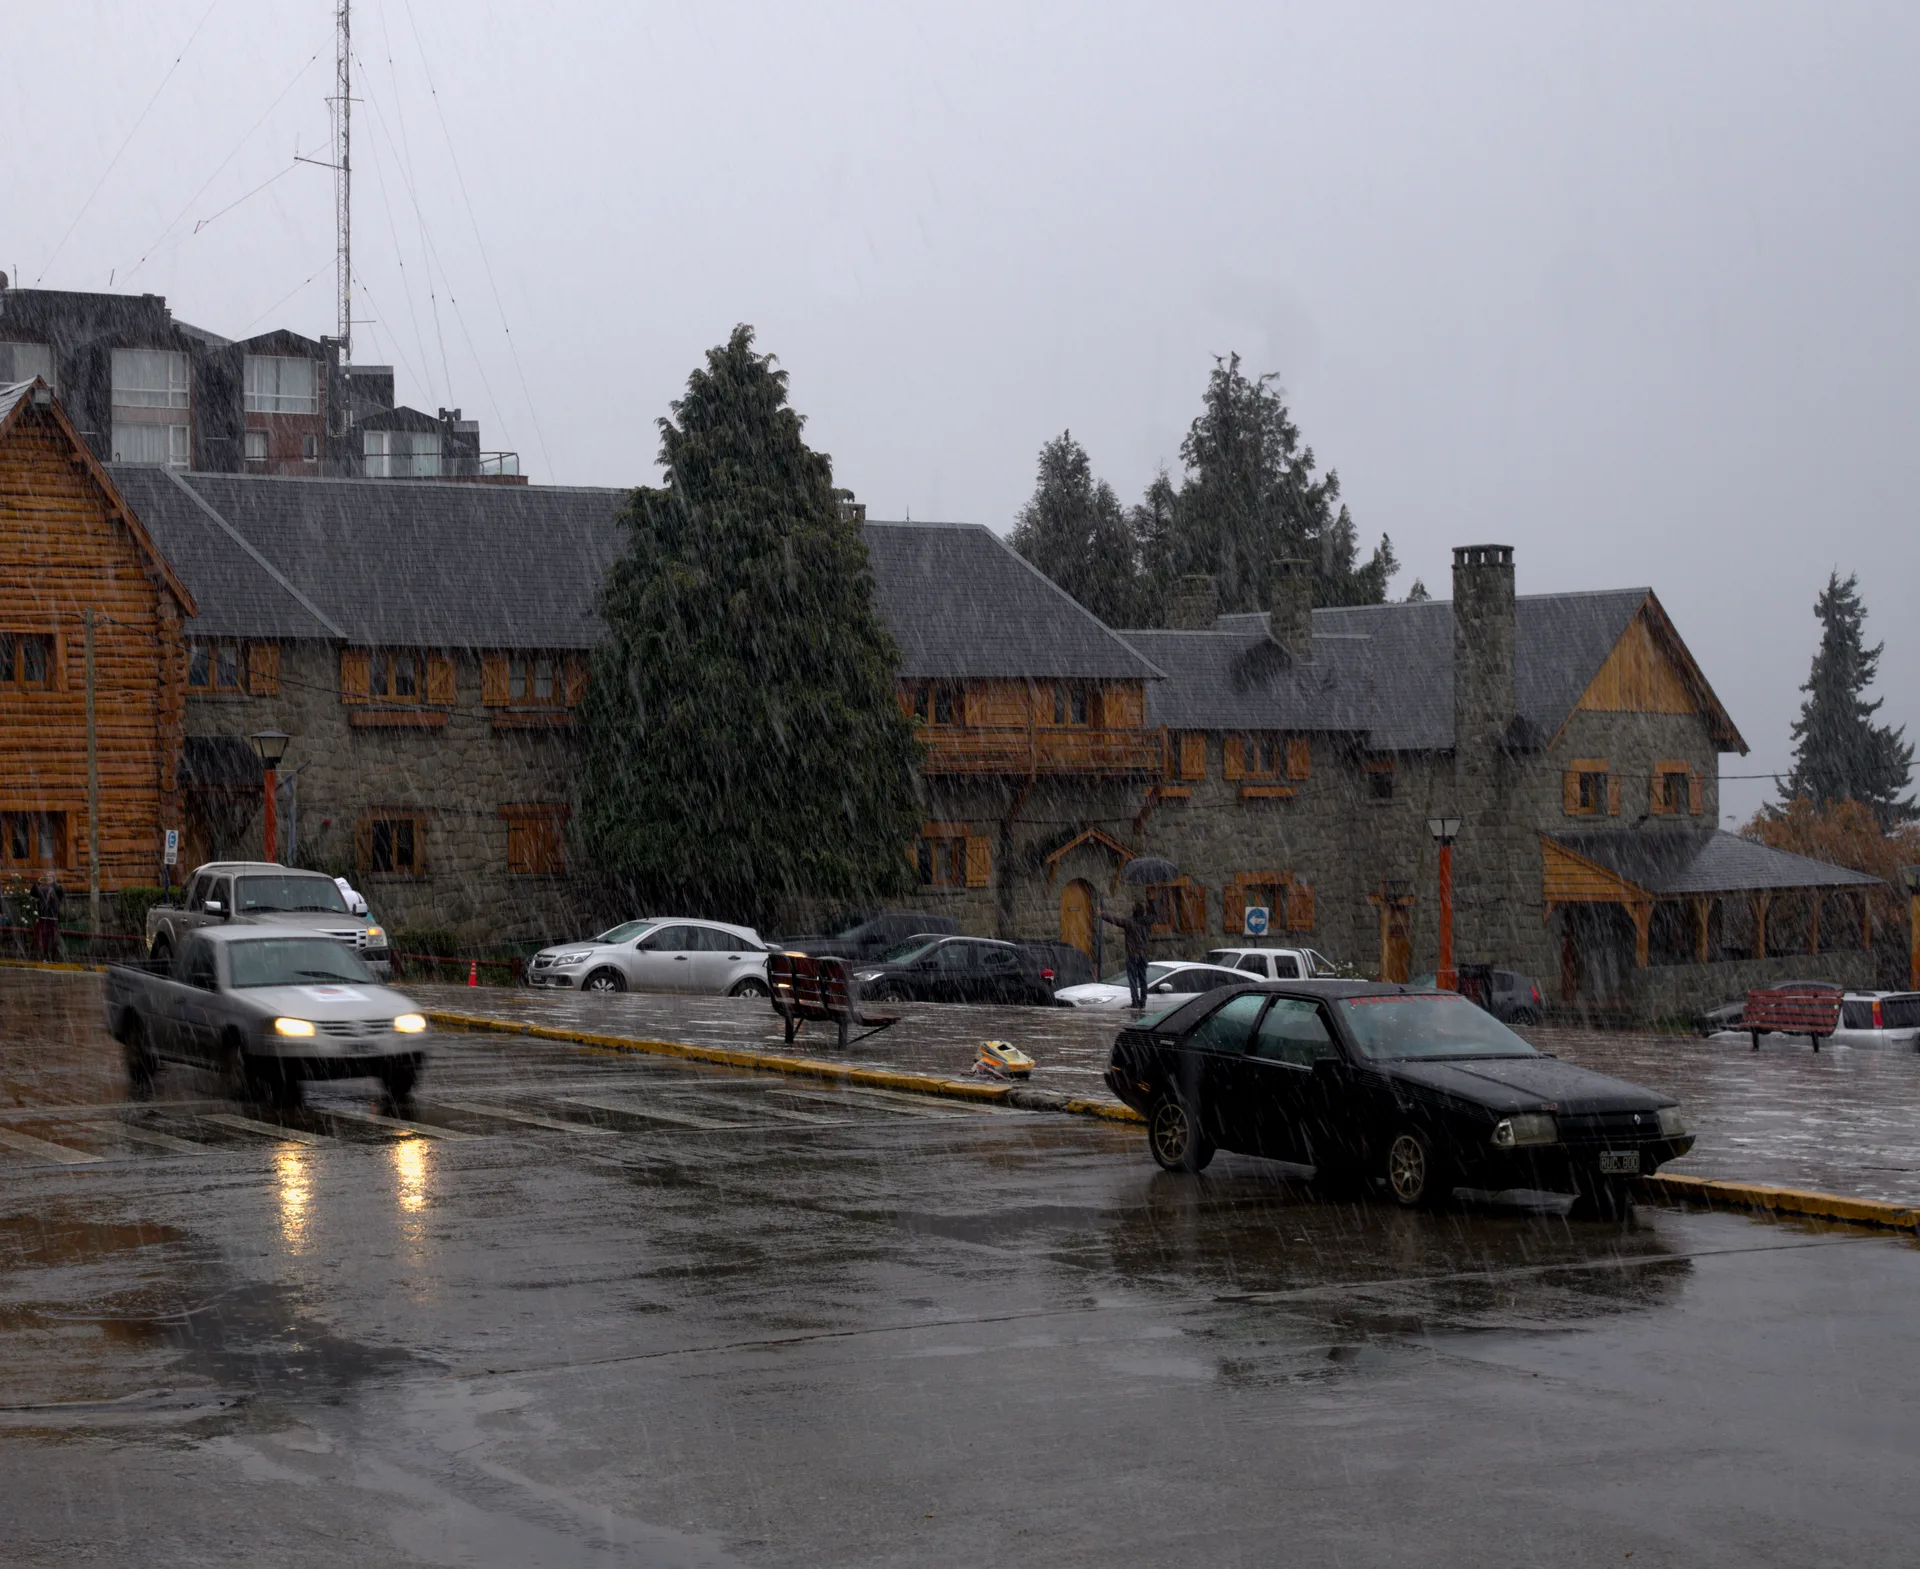
Centro Cívico during snowfall in May 2018. This historical scene is not a forecast. Resized and converted to WebP. Hero photo by Ezarate, CC BY-SA 4.0 (opens in a new tab), from Wikimedia Commons (opens in a new tab).