

Alta Gracia Weather
Alta Gracia Weather
Plan for heating, shade and storm drainage. The monthly chart is a nearby station reference, with the foothill difference stated plainly.
- Regional January high
- 31.2°C
- 1991 to 2020 daily average
- Regional July low
- 5.5°C
- 1991 to 2020 daily average
- Station separation
- About 34 km
- Straight-line regional reference
- Local elevation
- 550 to 650 m
- Municipal climate-plan range
On this page
The short answer
Alta Gracia's retained municipal plan identifies a foothill setting, elevations of 550 to 650 meters and heavy-rain runoff risks. The monthly chart uses Córdoba Observatorio, about 34 km straight-line away, as a regional reference. Its 1991 to 2020 norms show January average highs of 31.2°C (88.2°F) and July average lows of 5.5°C (41.9°F). These are not measured Alta Gracia normals or a current forecast.
- The inquiry centers on residents inspecting the actual building across seasons.
- The municipal 2026 to 2030 climate plan places Alta Gracia on the Sierras Chicas foothills and gives an elevation range of 550 to 650 meters.
- Córdoba Observatorio station 87345 has a 1991 to 2020 annual mean of 18.4 degrees Celsius and precipitation of 815.6 millimeters.
- The evidence gap remains explicit. No retained Alta Gracia station series establishes its own complete 1991 to 2020 normals.
What the evidence supports
A regional monthly reference
Tool
Alta Gracia by month
Córdoba Observatorio regional reference, about 34 km away, 1991 to 2020 normals.
Average highs range from 65°F to 88°F. Rainfall peaks at 143.9 mm a month. SMN 1991 to 2020 normals retained by NOAA. CORDOBA_OBSERVATORIO_87345.csv (opens in a new tab)
| Month | High and low °C | Rain and rain days |
|---|---|---|
| January | 31.2 and 18.9 | 121.6 mm over 8.8 days |
| February | 29.4 and 17.8 | 126.6 mm over 8.4 days |
| March | 28.1 and 16.5 | 99.9 mm over 7.6 days |
| April | 25 and 13.3 | 61.2 mm over 5.6 days |
| May | 21.3 and 9.9 | 20.7 mm over 3.3 days |
| June | 19 and 6.4 | 6.7 mm over 1 days |
| July | 18.4 and 5.5 | 6.7 mm over 1.3 days |
| August | 21.5 and 7.4 | 8 mm over 1 days |
| September | 23.8 and 10 | 33.7 mm over 3.1 days |
| October | 26.3 and 13.4 | 76.9 mm over 5.9 days |
| November | 29.1 and 15.8 | 109.7 mm over 8.3 days |
| December | 31 and 18.1 | 143.9 mm over 9.6 days |
Source 1
Geography and the census boundary
The municipal 2026 to 2030 climate plan places Alta Gracia on the Sierras Chicas foothills and gives an elevation range of 550 to 650 meters.2
Climate reference and local hazards
Córdoba Observatorio station 87345 has a 1991 to 2020 annual mean of 18.4 degrees Celsius and precipitation of 815.6 millimeters.1
The station is in Córdoba, about 34 km straight-line from the Alta Gracia locality centroid. It is the closest of three retained reference stations, not a verified Alta Gracia station. Foothill elevation and rainfall can differ.1
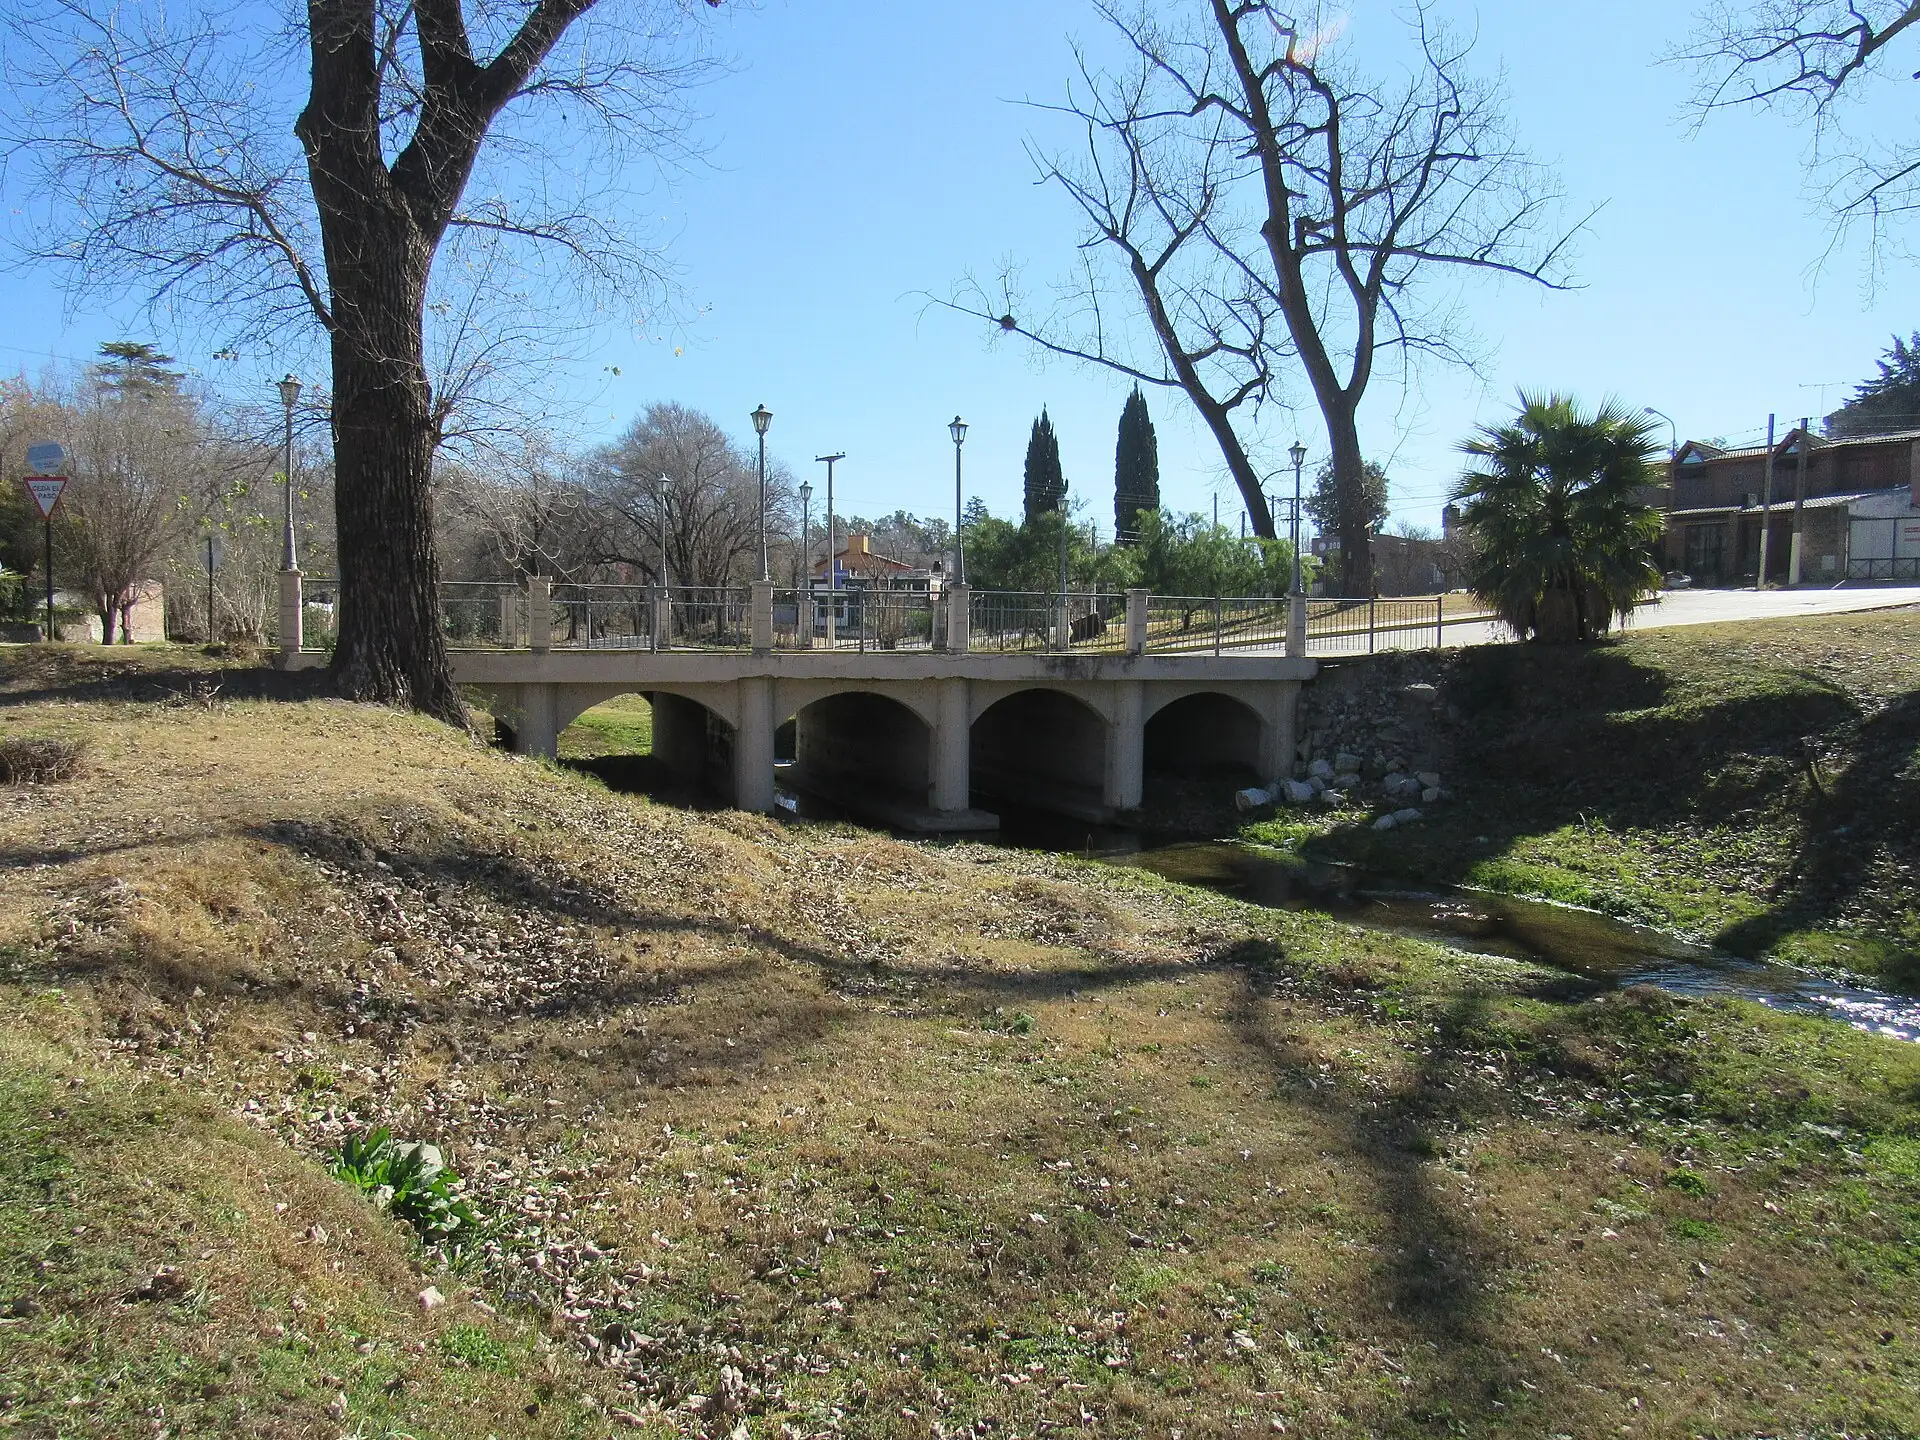
The municipal climate plan identifies heavy-rain runoff, stream overflow and drainage problems as local risks, including the Chicamtoltina stream system.2
City climate planning. No parcel, neighborhood ranking or current warning is inferred. Check the exact property and official alerts.2
What remains unknown
Risk evidence and scope
The municipality publishes 911 for police emergencies and 100 for firefighters in its August 12, 2025 fire-prevention guidance.3
Published emergency contacts, not a current fire alert or response-time measurement.3
Turn this topic into the next decision
- utilities. Check the energy source and actual seasonal bills.
- rent. Ask how the specific home handles heat, cold and drainage.
- safety. Keep weather hazards separate from crime comparisons.
- weekend trips. Check the live warning before leaving for a regional destination.
- parque virrey. Investigate heating in the two advertised homes without gas.
- retire. Match temperature comfort to your own health and daily routine.
Questions people ask
What source supports the Alta Gracia monthly weather chart?
SMN's Córdoba Observatorio station 87345 record, retained by NOAA. It covers 1991 to 2020 and remains explicitly a regional reference.
How far is the climate reference from Alta Gracia?
About 34 km straight-line from the official locality centroid. This is a geographic calculation, not a driving distance or a claim about the nearest live weather station.
What summer heat does the regional Alta Gracia reference show?
January average daily highs are 31.2°C (88.2°F). Individual hot days can differ. Inspect shade, airflow and cooling in the actual property.
What winter cold does the regional Alta Gracia reference show?
July average daily lows are 5.5°C (41.9°F). Those averages are not a minimum-temperature guarantee. Check the heating system and its energy source.
What annual rainfall is shown in the Alta Gracia reference?
The Córdoba Observatorio normal is 815.6 mm annually. It is not a measured Alta Gracia annual total. Foothill weather and elevation can differ.
Does the Alta Gracia chart give the current forecast?
No. Climate normals describe a historical period. Use a current official forecast and warning before travel or outdoor activity.
Does every Alta Gracia rental have gas heating?
No. Two retained Parque Virrey examples explicitly list no gas connection. Ask how the particular home is heated and obtain actual winter bills.
Can the climate plan rank Alta Gracia neighborhoods for flood safety?
No parcel or neighborhood ranking was established. The plan identifies city risks. Obtain property history and location-specific official information.
Plan your move
Get a free relocation plan for Alta Gracia.
Answer three questions and get your tasks in order, ready to print or save.
- Answer three questions
- Get your tasks in order
- Print it or save it
Our packages are available for moves to Santiago today. For other cities, we confirm providers, requirements, and fees before you pay.
Sources and how we check them
Sources and how we check them3 sources
Every figure on this page comes from the official or primary source listed here. We checked them in . Rules and prices change, so confirm anything important with the source before you act on it.
- SMN 1991 to 2020 normals retained by NOAA. CORDOBA_OBSERVATORIO_87345.csv (opens in a new tab)
- Municipality of Alta Gracia climate-action premises 2026 through 2030 (opens in a new tab)
- Alta Gracia municipal fire prevention and emergency contacts. August 12, 2025 (opens in a new tab)
Arroyo Chicamtoltina in Alta Gracia, photographed in 2021. Hero photo by Jmmuguerza, CC BY-SA 4.0 (opens in a new tab), from Wikimedia Commons (opens in a new tab).